Stories from the night sky

Screenshot with a big text that reads 'Stories from the night sky' in bold white letters on a dark blue background. On top there is a star-shaped icon and below the large text, smaller text reads 'A data-driven visual experiment.' and on a new line 'By Sebastian Lammers'.

Description

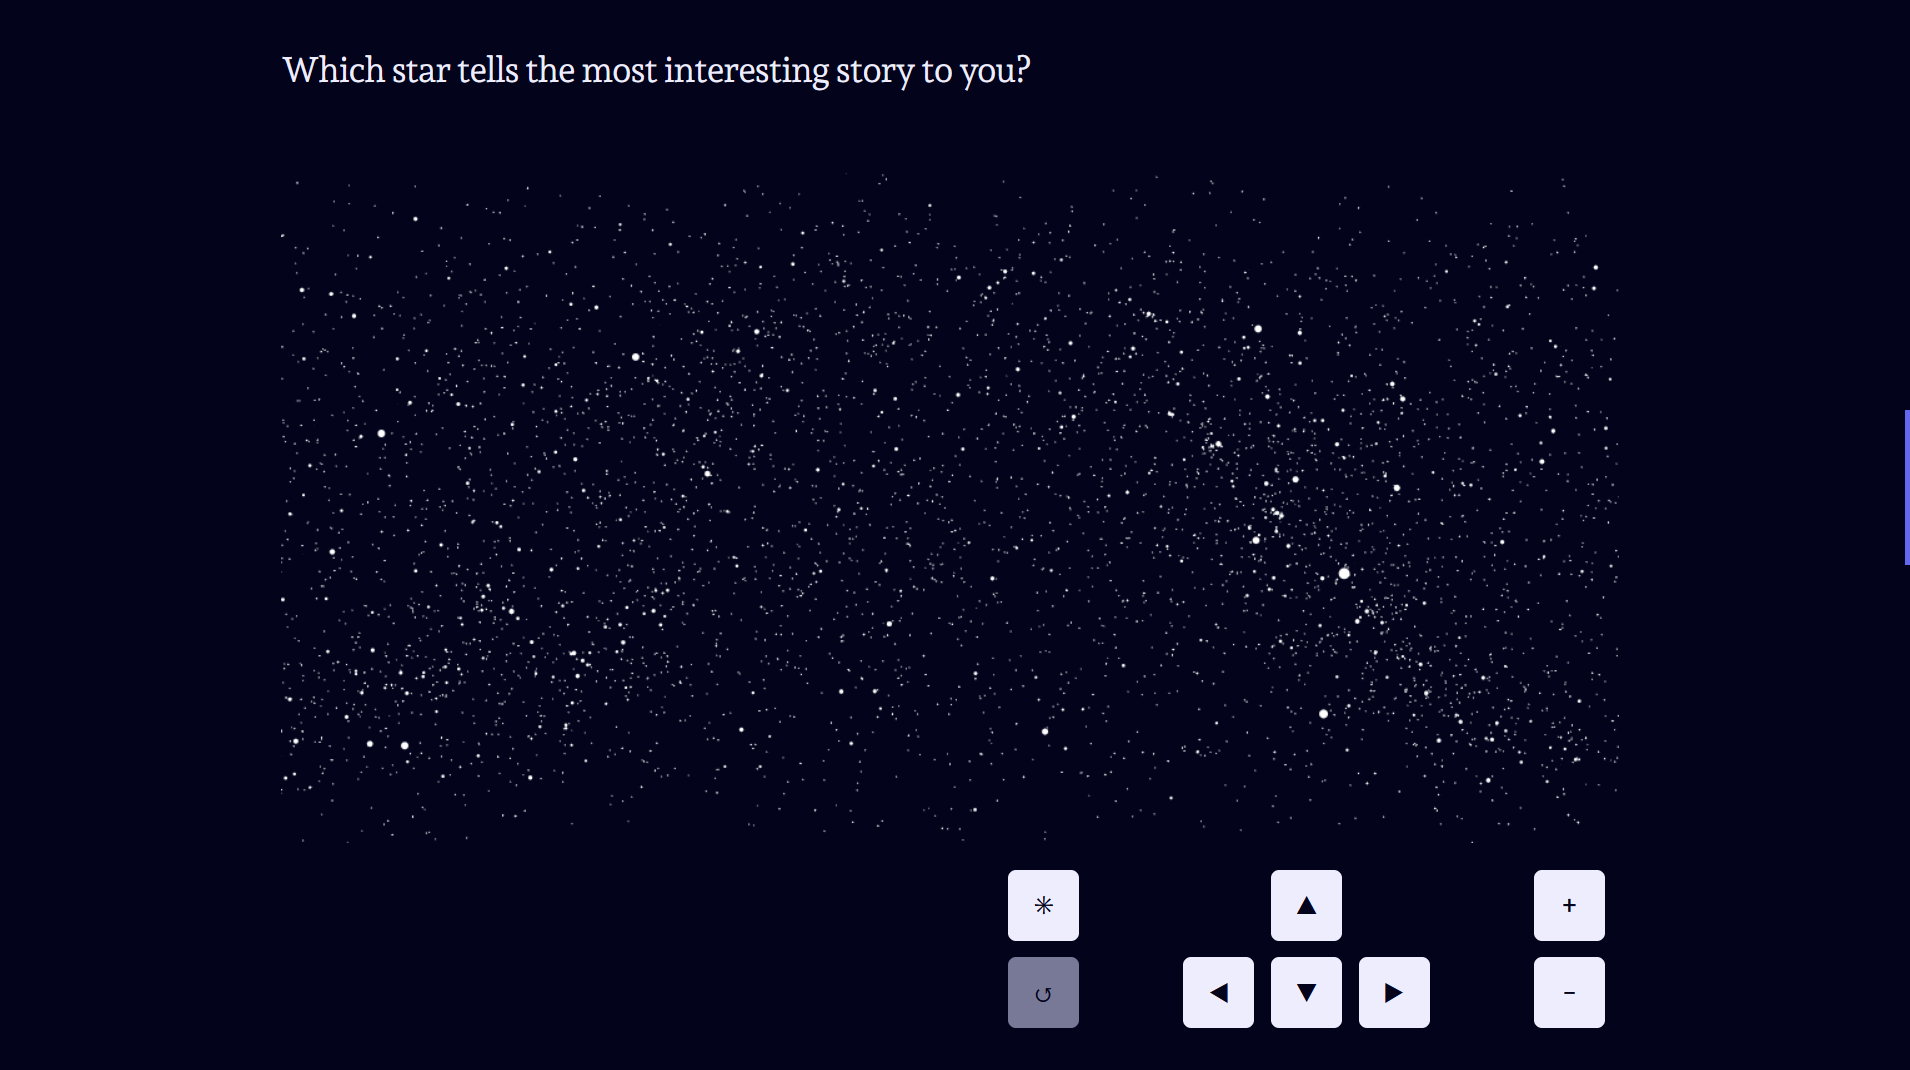
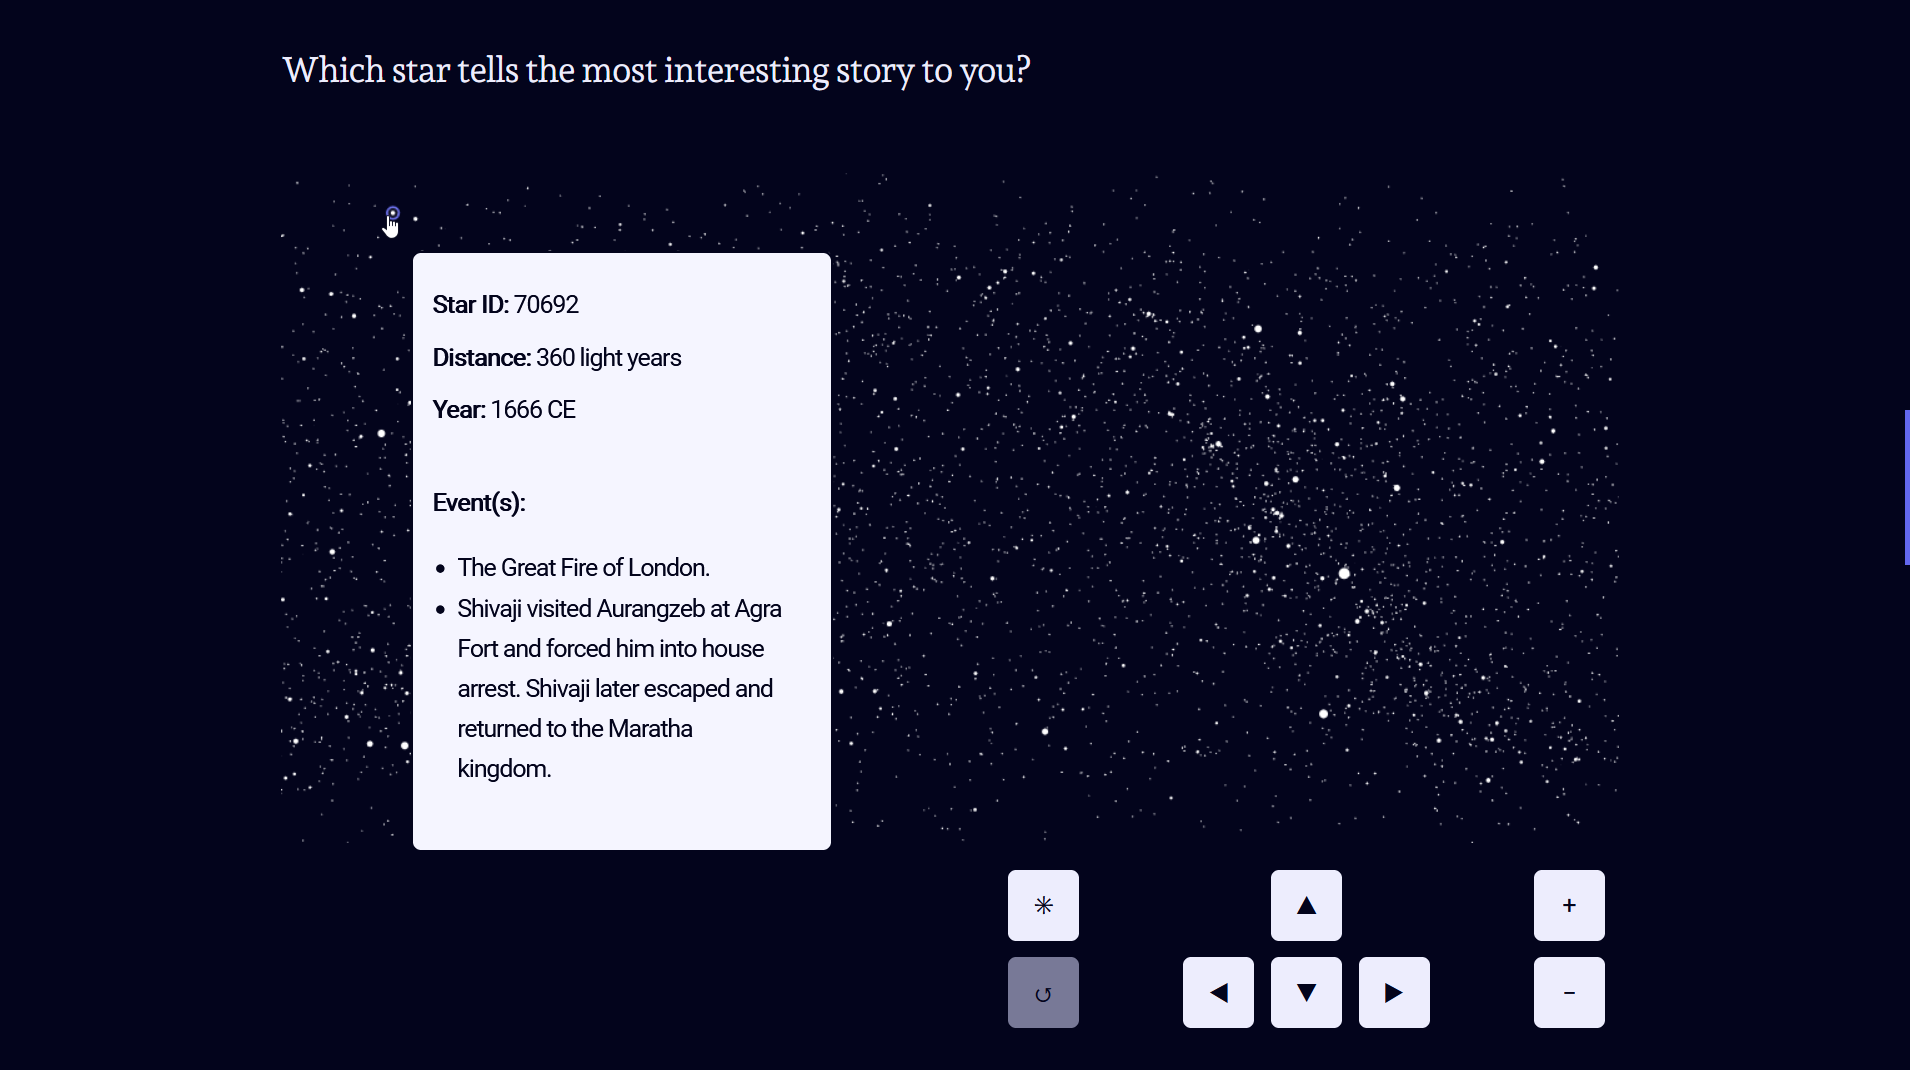
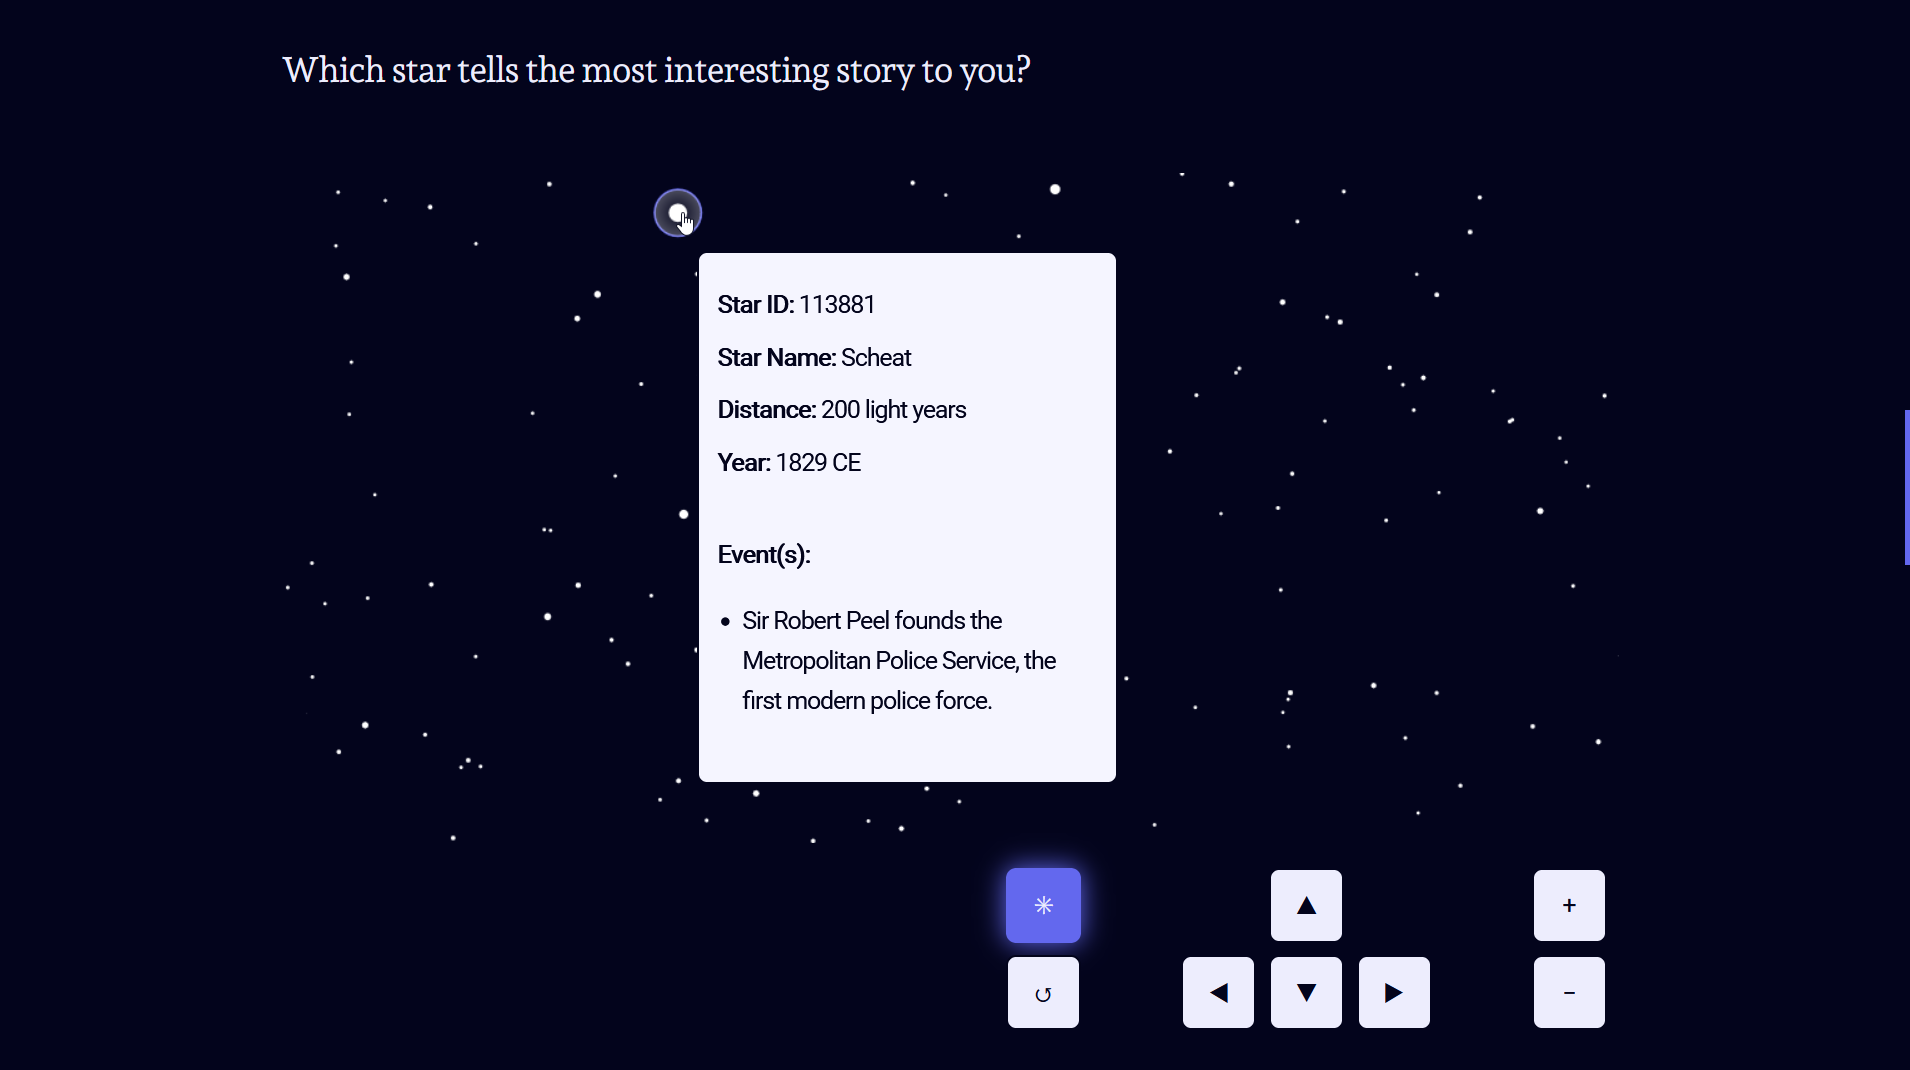
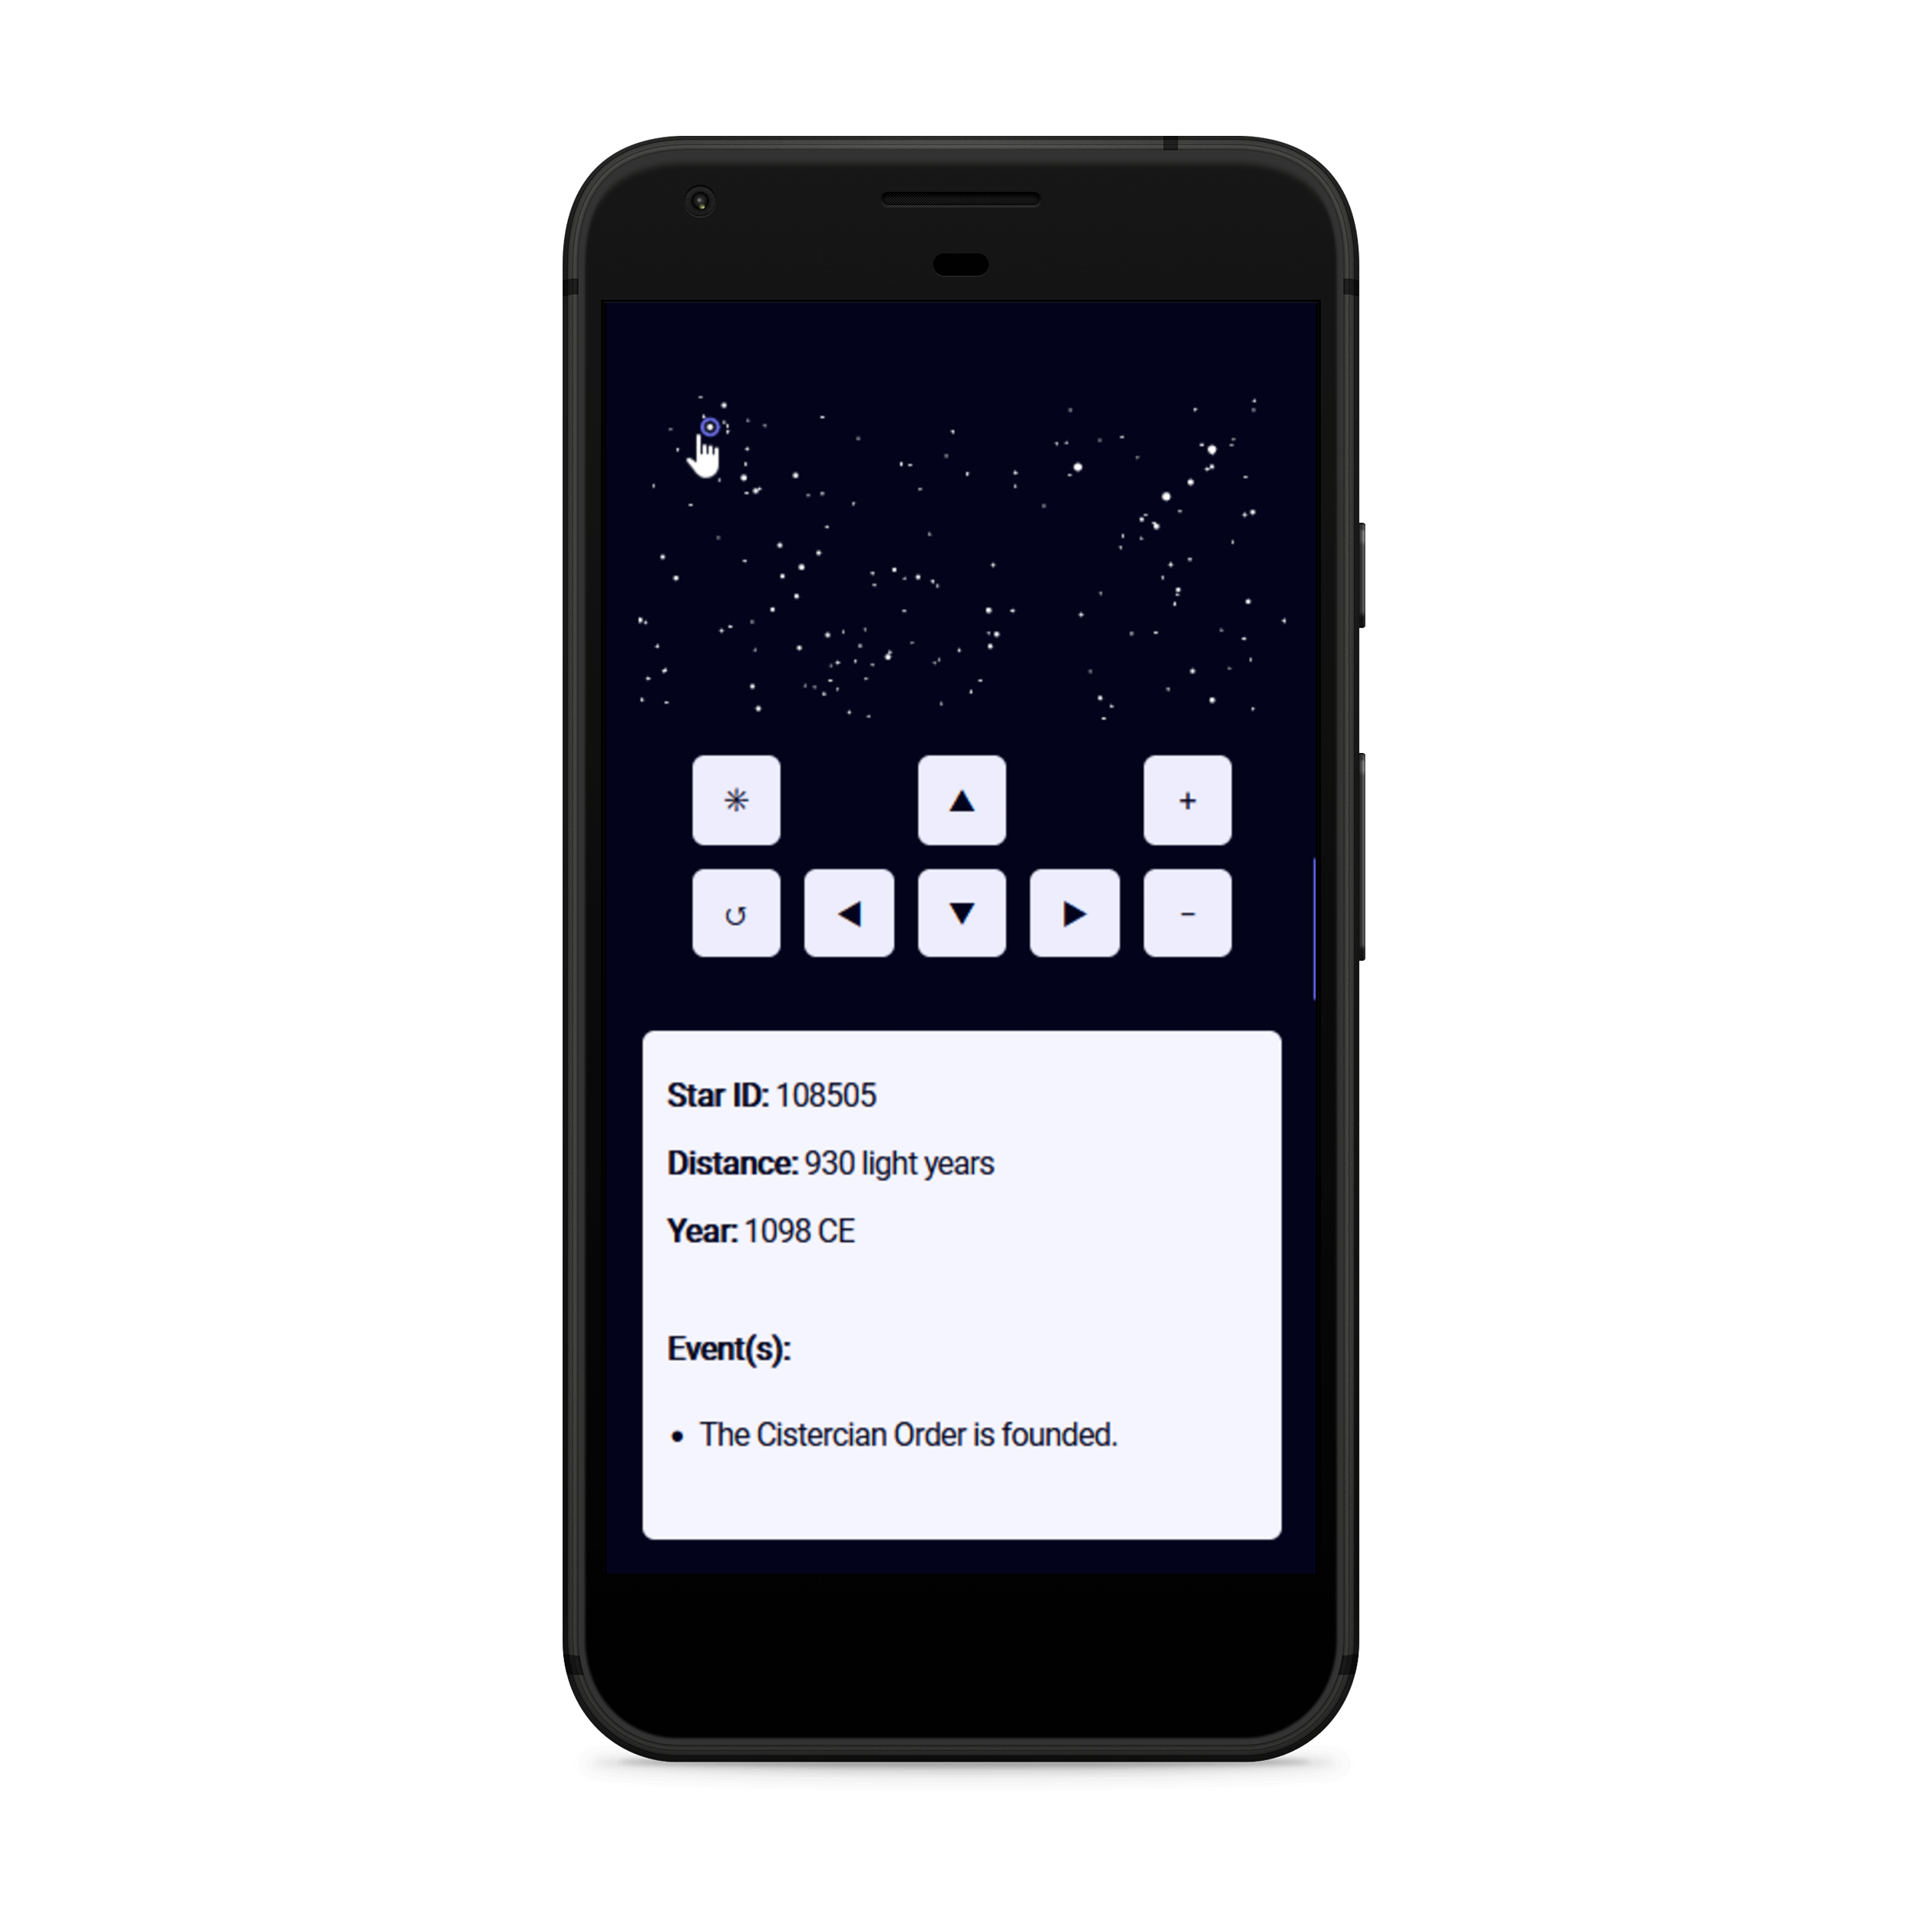
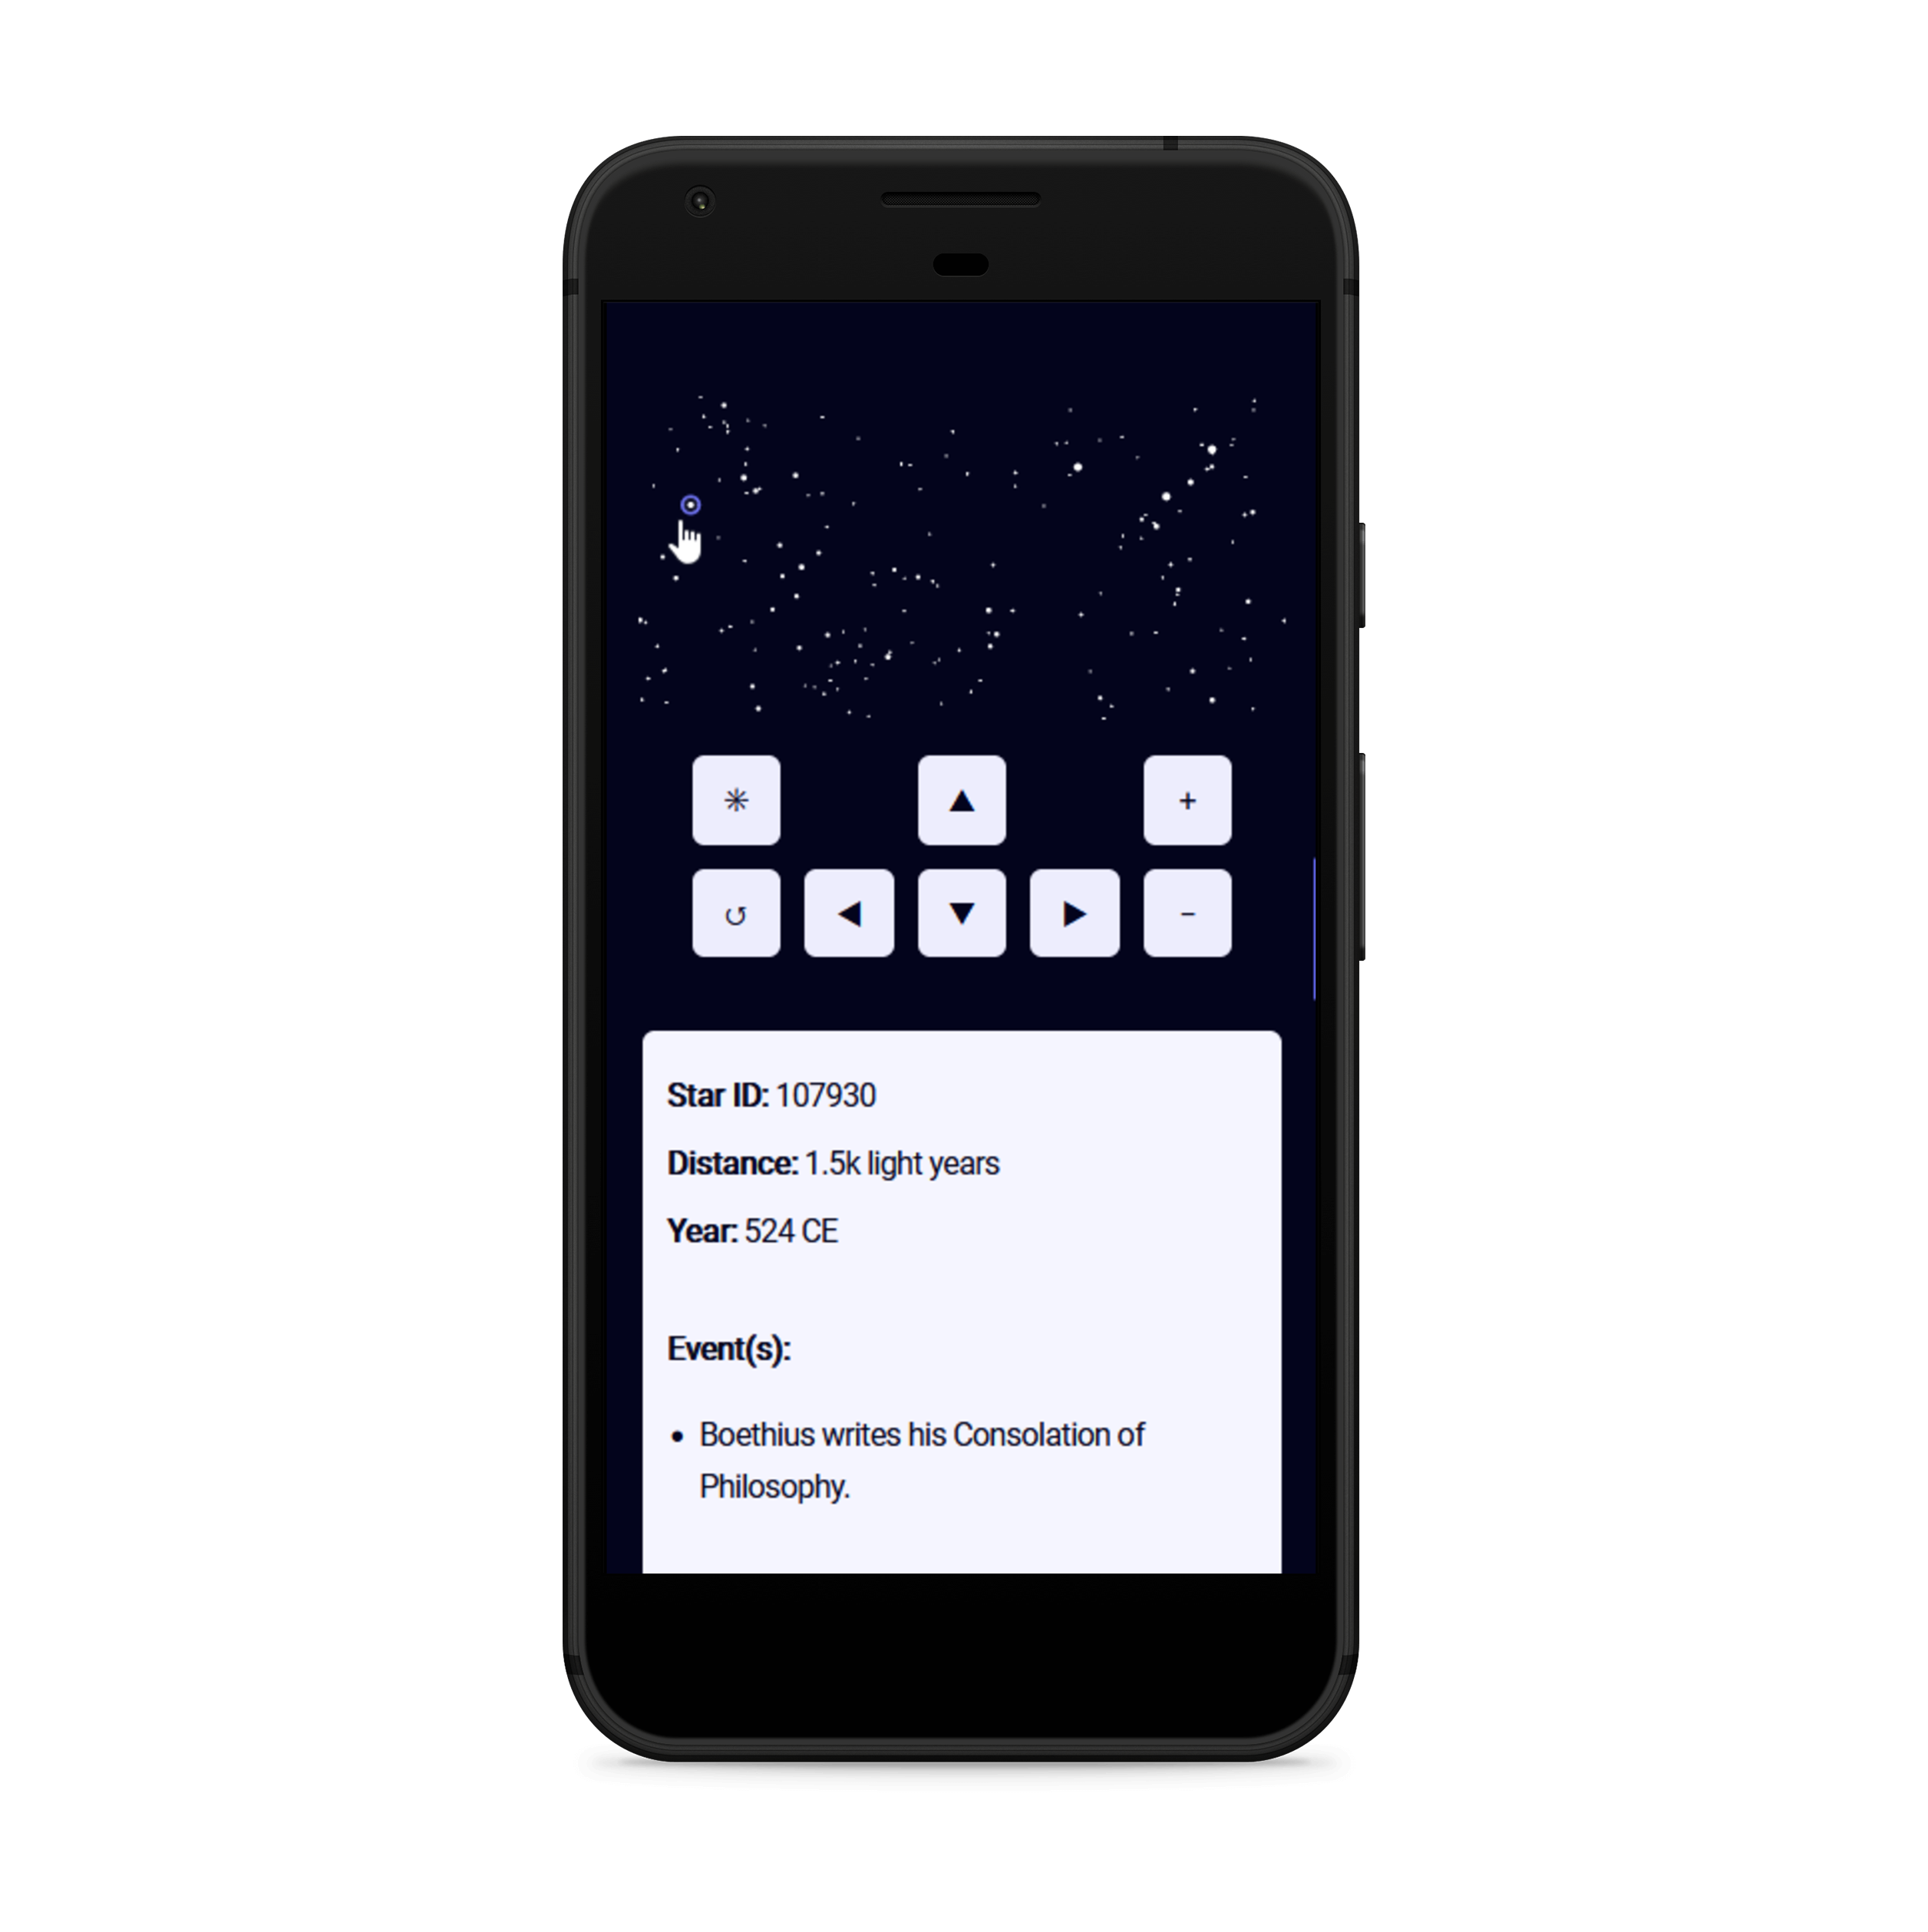
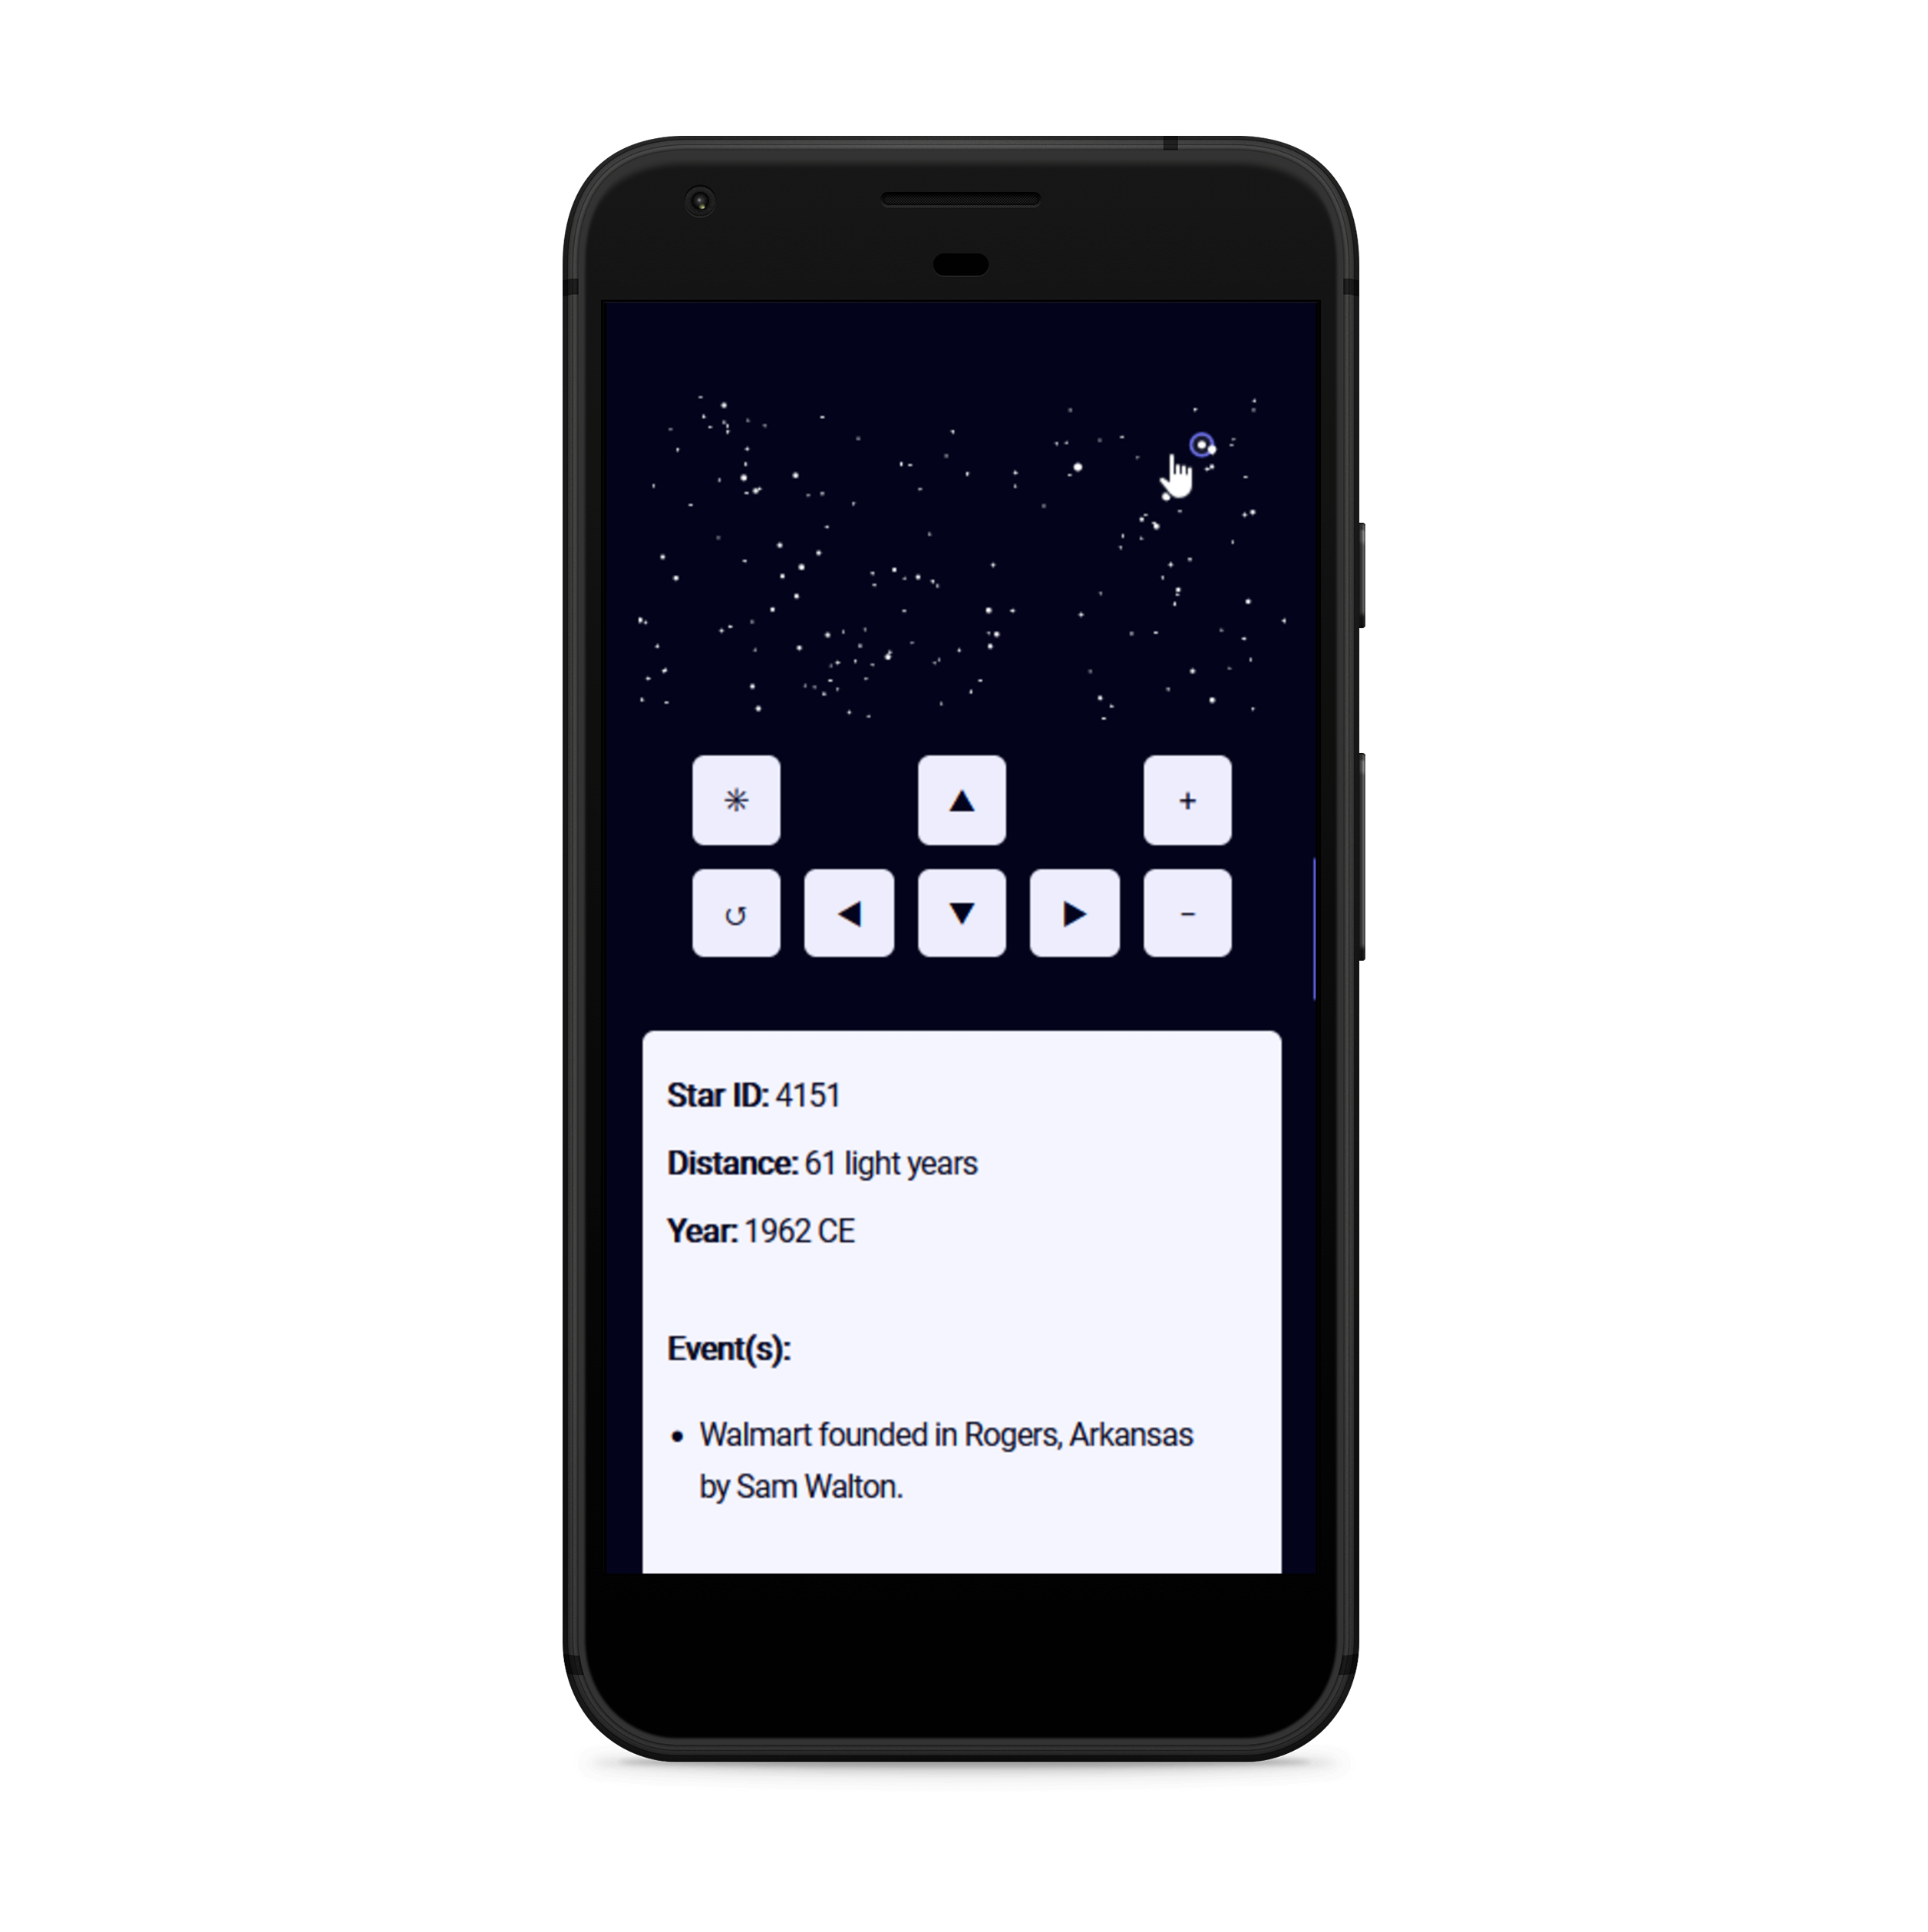
Stories from the night sky is a data-driven visual experiment: The light from the stars travels for years (and years) until it reaches your eyes. This interactive map of the night sky shows you for each star what happened on Earth when the light started traveling from the star to you. That way, any star has a story to tell you. You can zoom in, move around and hover all the stars to reveal the historical events they are connected to.

Explore this project

Technologies used

More details can be found in my making-of blog post over here.

Screen-recording of the whole project

Extensive screen-recording that showcases the whole project including introductory text, notes, and methods.

Images

Screenshot of a map of the night sky. On top there is text that reads 'Which star tells the most interesting story to you?'. The map shows around 5,000 stars, depicted as white circles on a dark blue background. Below the map there is a group of buttons that include arrow buttons for all directions, zoom-buttons, a reset button and a button with a star-symbol. Screenshot of a map of the night sky. On top there is text that reads 'Which star tells the most interesting story to you?'. The map shows around 5,000 stars, depicted as white circles on a dark blue background. Below the map there is a group of buttons that include arrow buttons for all directions, zoom-buttons, a reset button and a button with a star-symbol. Screenshot of a map of the night sky. On top there is text that reads 'Which star tells the most interesting story to you?'. The map shows around 50-60 stars, depicted as white circles on a dark blue background. A computer cursor shaped like a hand is hovering one of the stars. This star is enlarged and has a purple outline. Right below the cursor there is a white tooltip textbox that contains information about the hovered star. The information reads as follows. Star ID: 113881. Star Name: Scheat. Distance: 200 light years. Year: 1829 CE. Event(s): Sir Robert Peel founds the Metropolitan Police Service, the first modern police force. Below the map there is a group of buttons that include arrow buttons for all directions, zoom-buttons, a reset button and a button with a star-symbol. A smartphone that displays the interactive map. The tooltip is shown below the control buttons instead of near the cursor. In this particular image, the event in the tooltip is 'The Cisterian Order is founded.', which dates back to the year 1098 CE. A smartphone that displays the interactive map. The tooltip is shown below the control buttons instead of near the cursor. In this particular image, the event in the tooltip is 'Boethius writes his Consolation of Philosophy.', which dates back to the year 524 CE. A smartphone that displays the interactive map. The tooltip is shown below the control buttons instead of near the cursor. In this particular image, the event in the tooltip is 'Walmart founded in Rogers, Arkansas by Sam Walton.', which dates back to the year 1962 CE. Explore this project

© 2023-2024 Sebastian Lammers

Scroll to top ↑