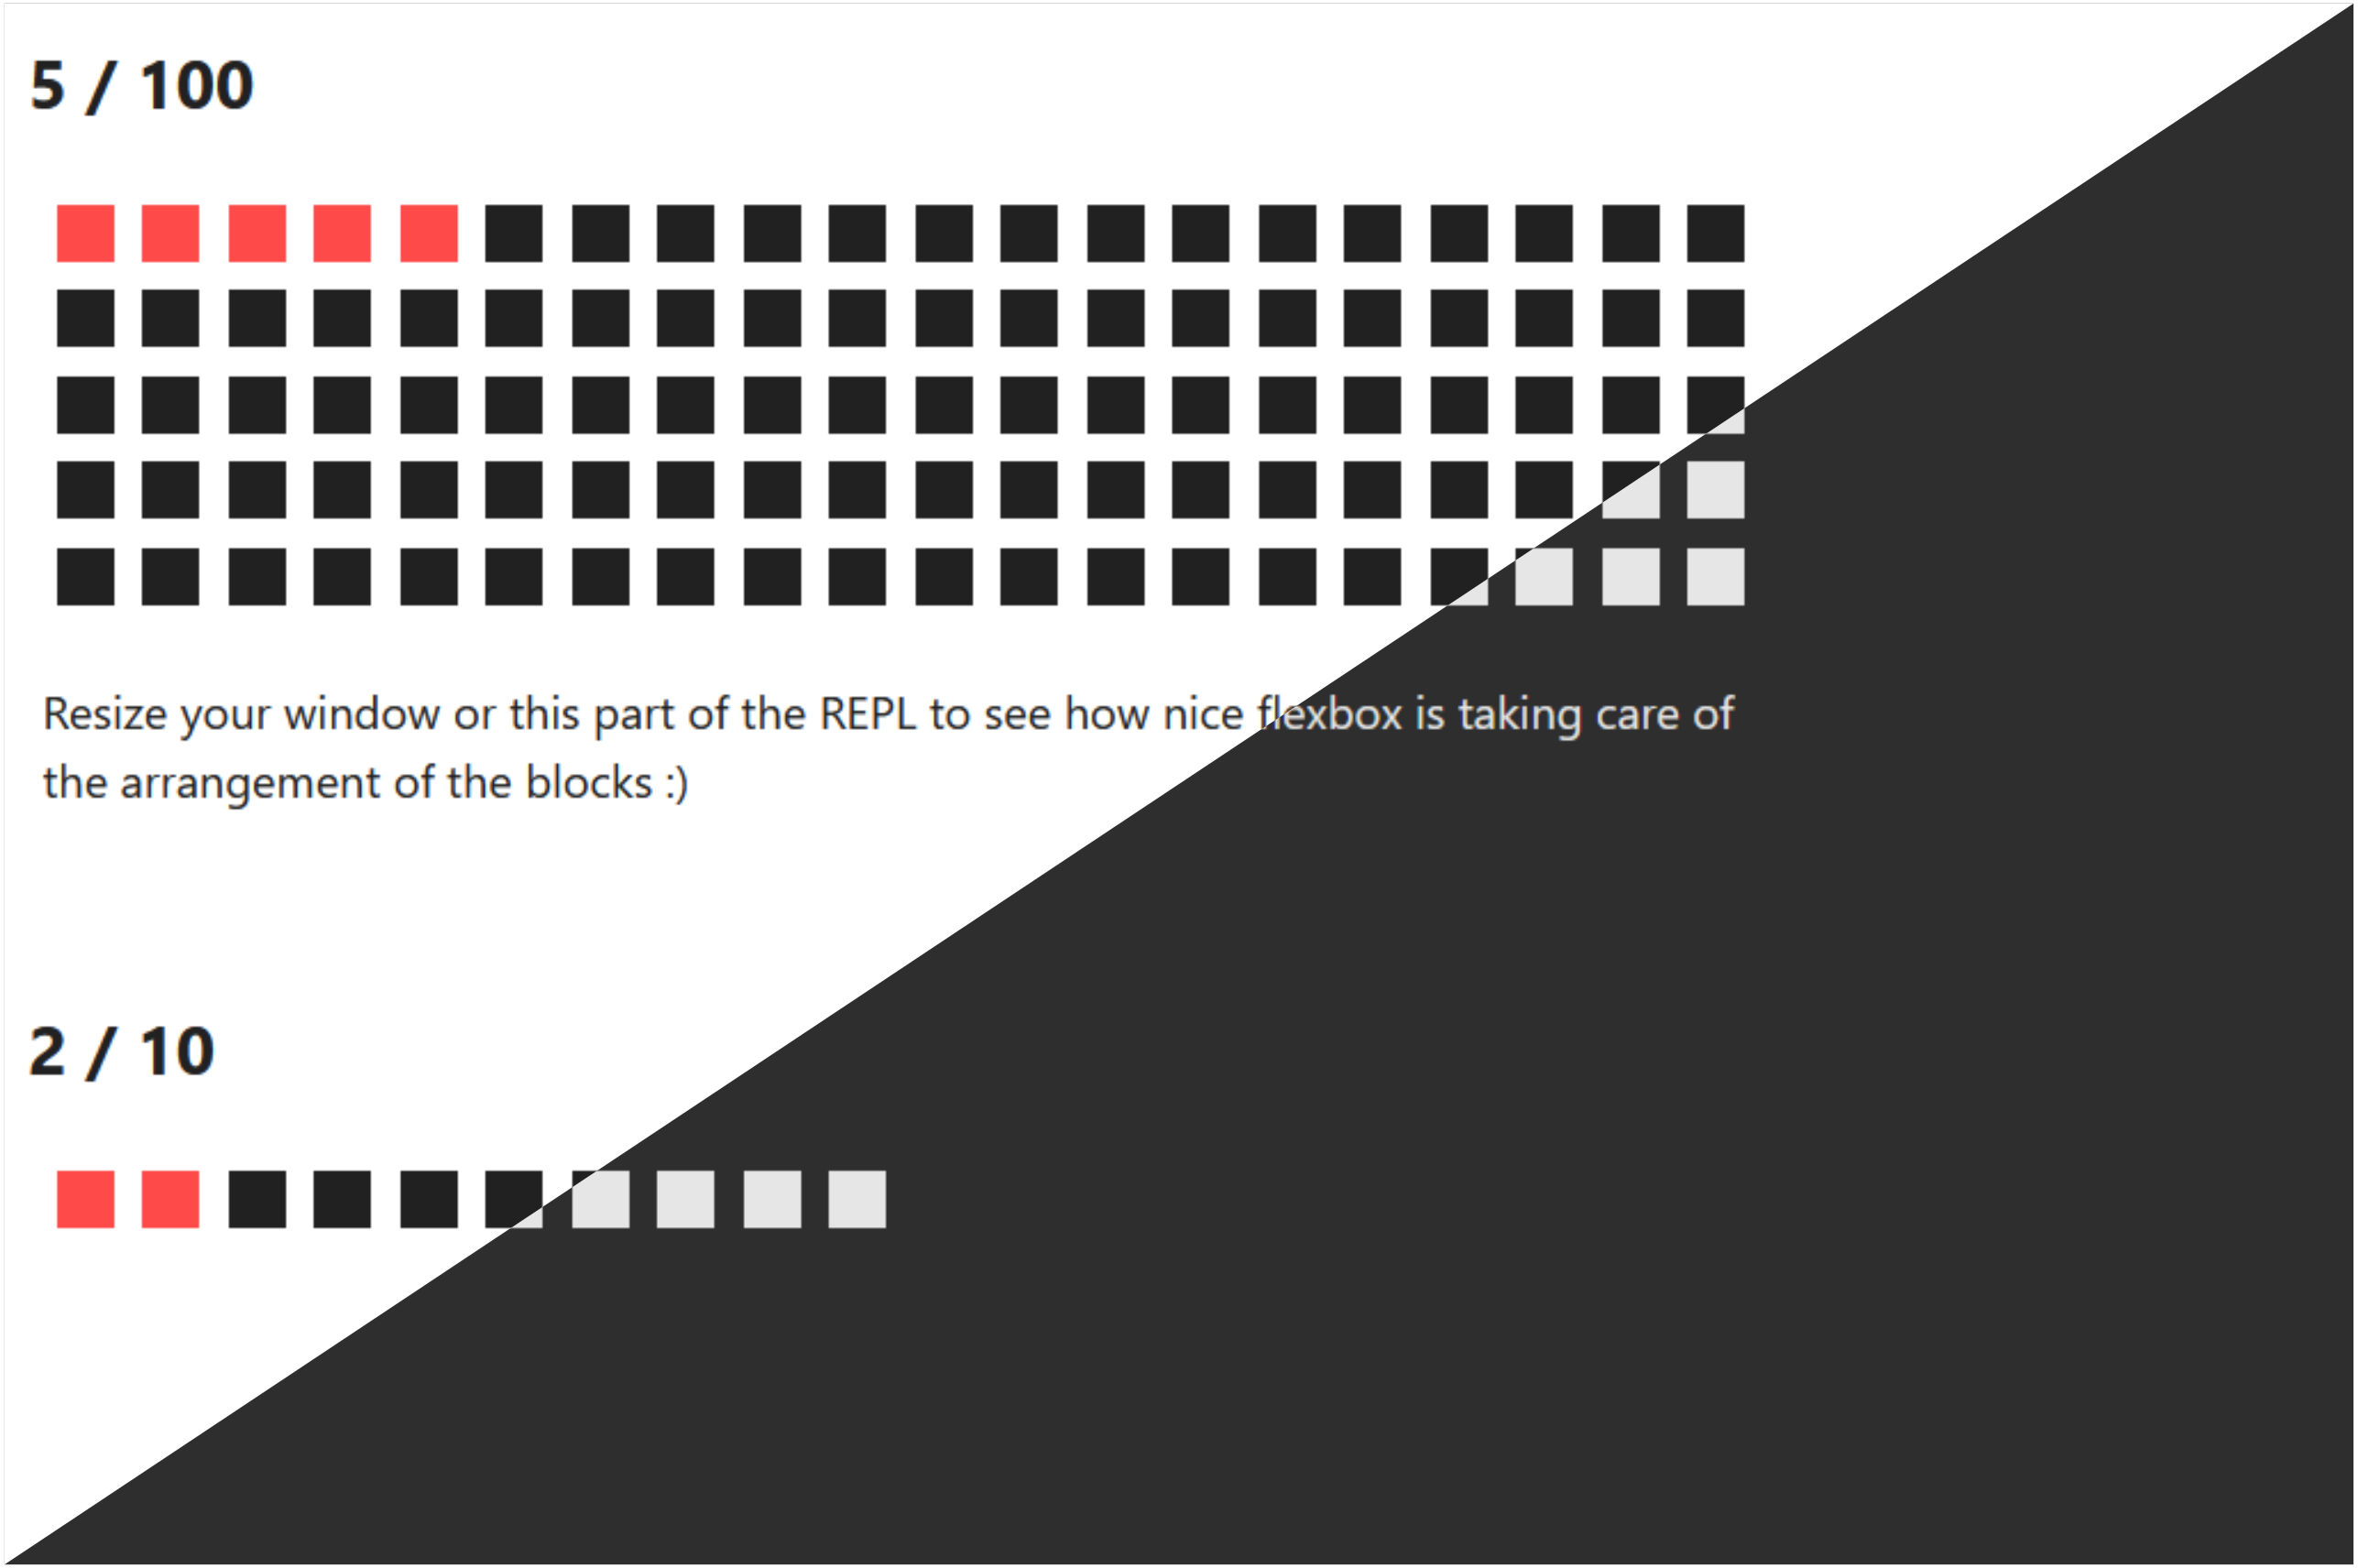
Waffle Chart
Read More

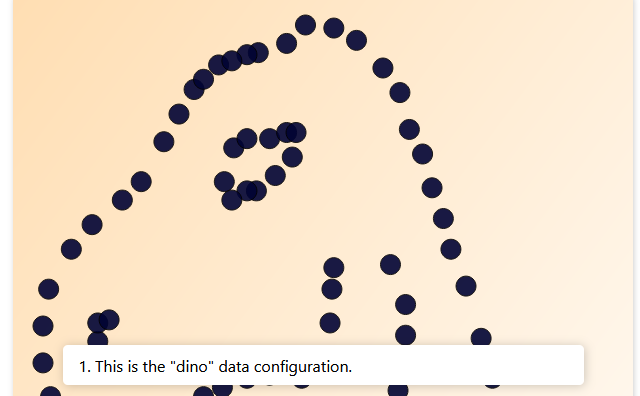
Morphing SVG Shapes
Read More
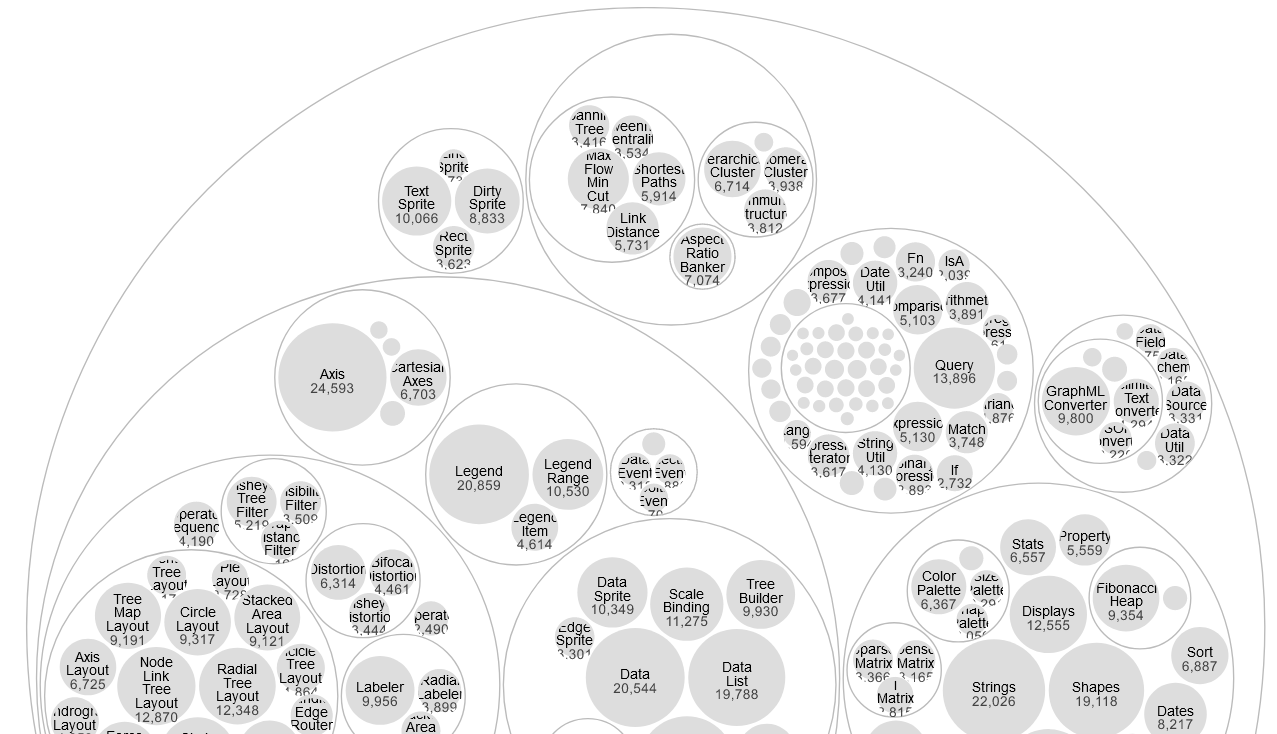
Circle Packing
Read More
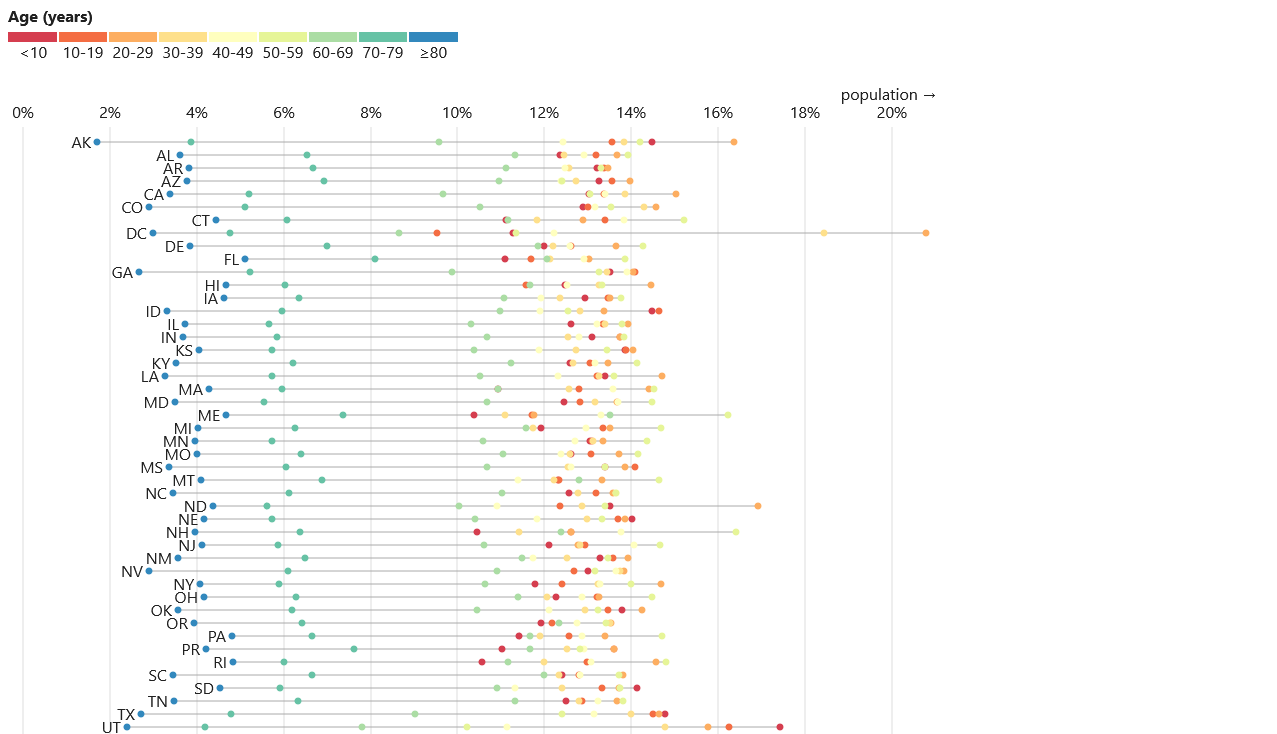
Dot Plot
Read More
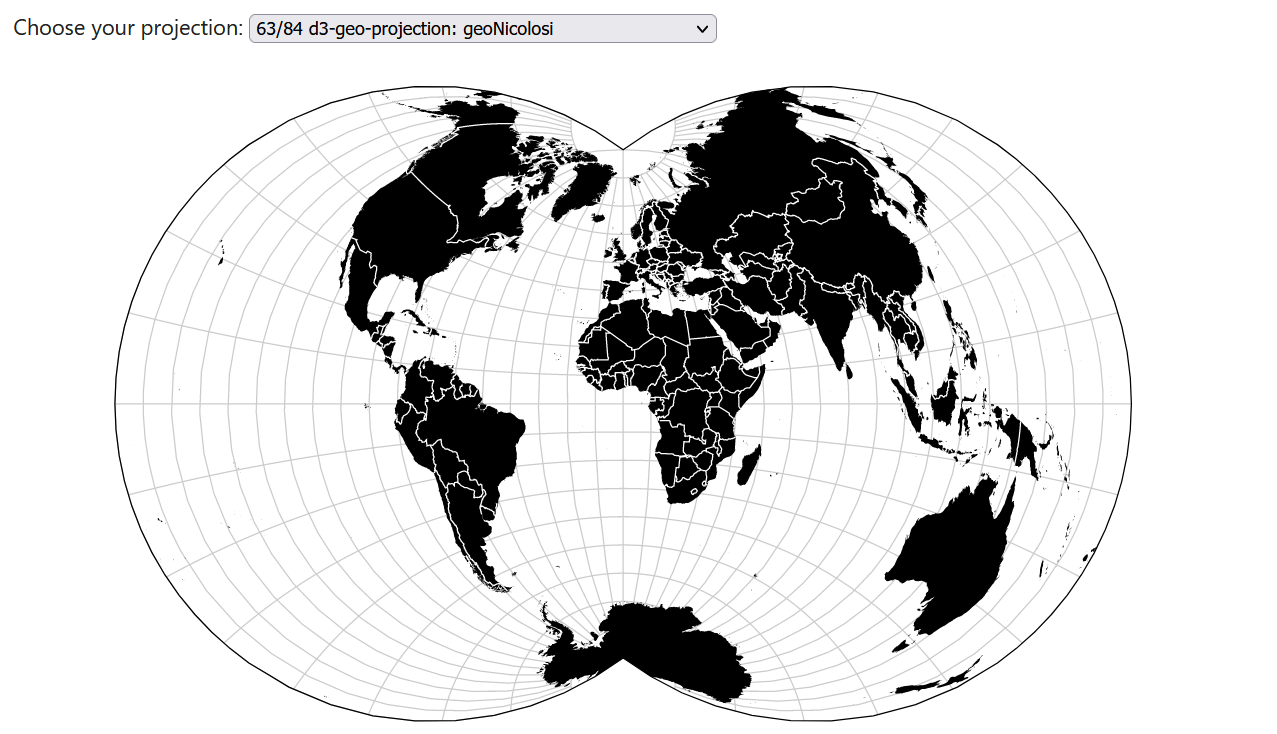
World Map Projections
Read More
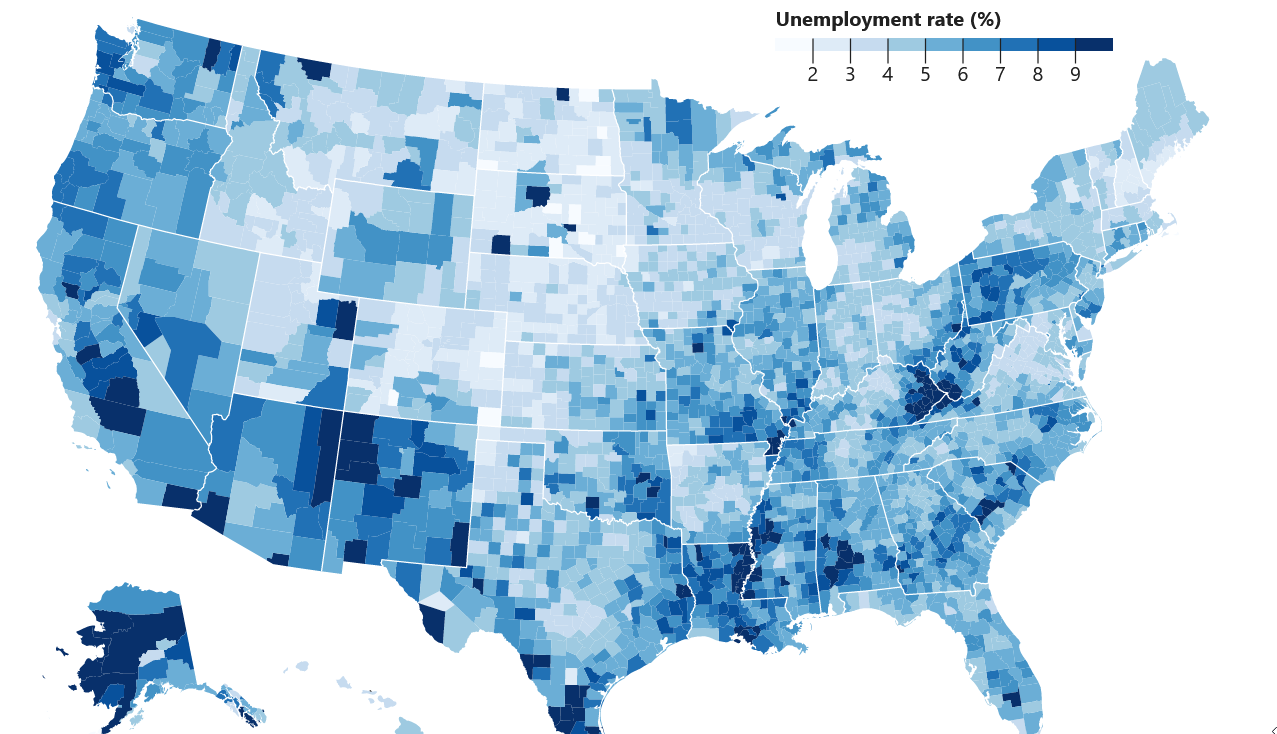
Choropleth Map
Read More
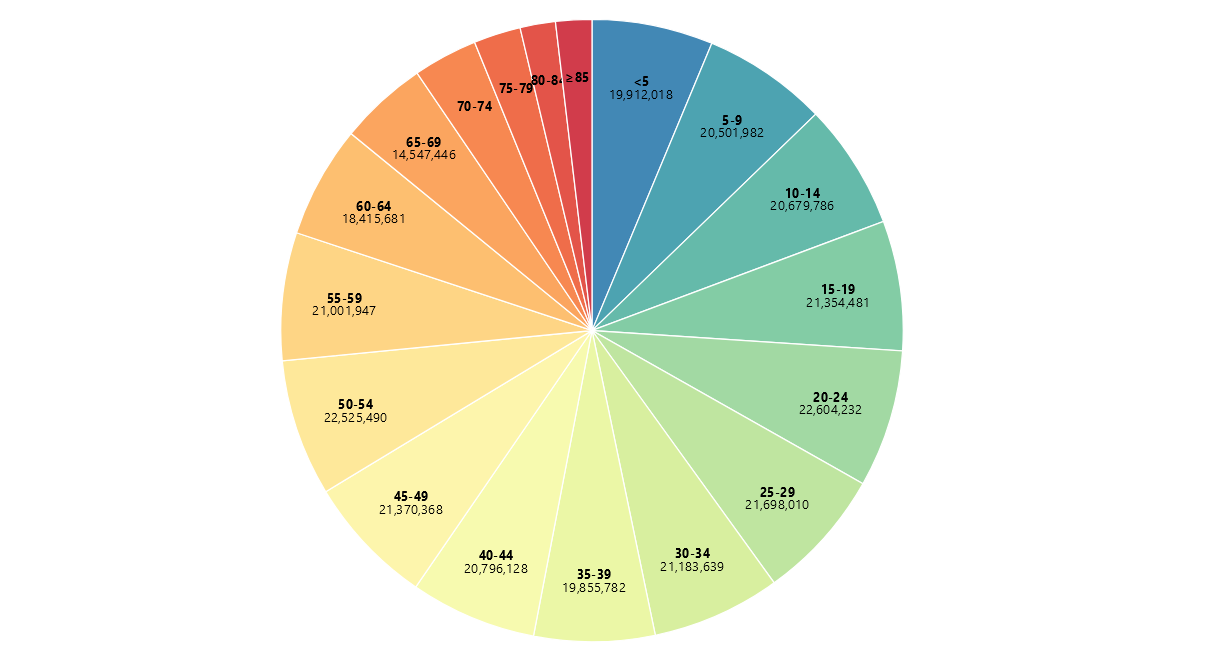
Pie Chart
Read More
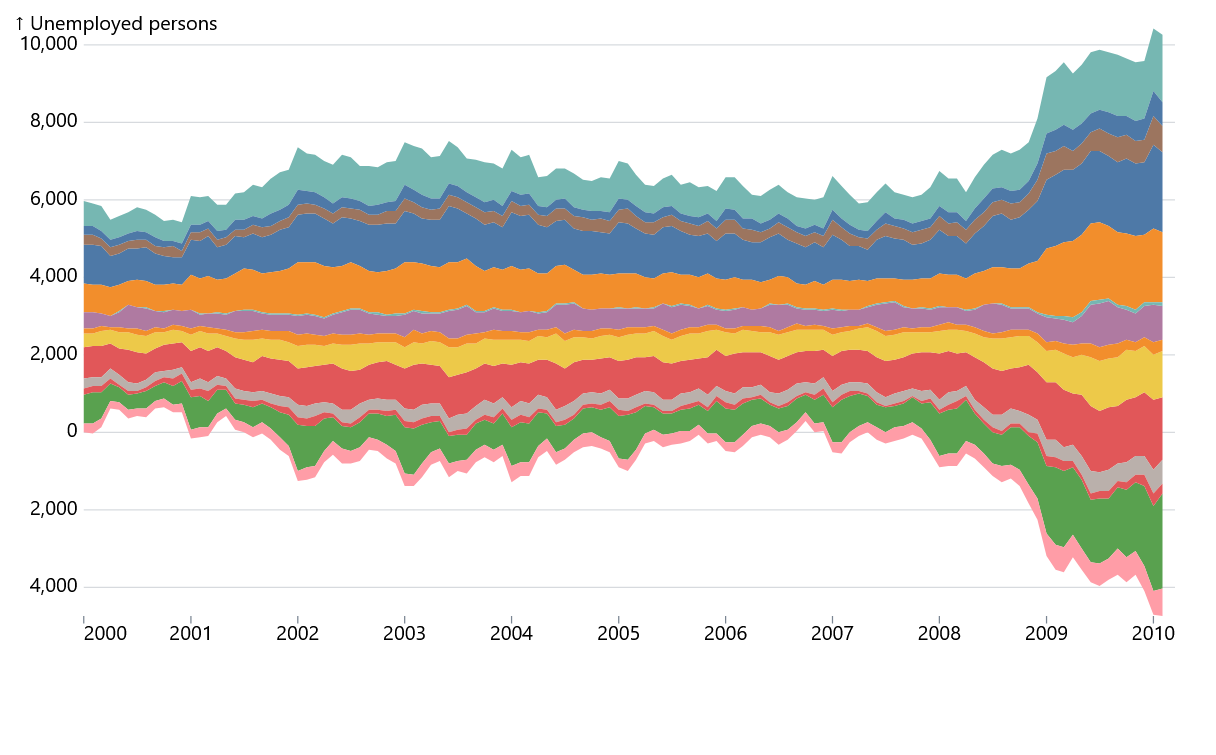
Streamgraph
Read More
Scrollytelling Scatterplot
Read More
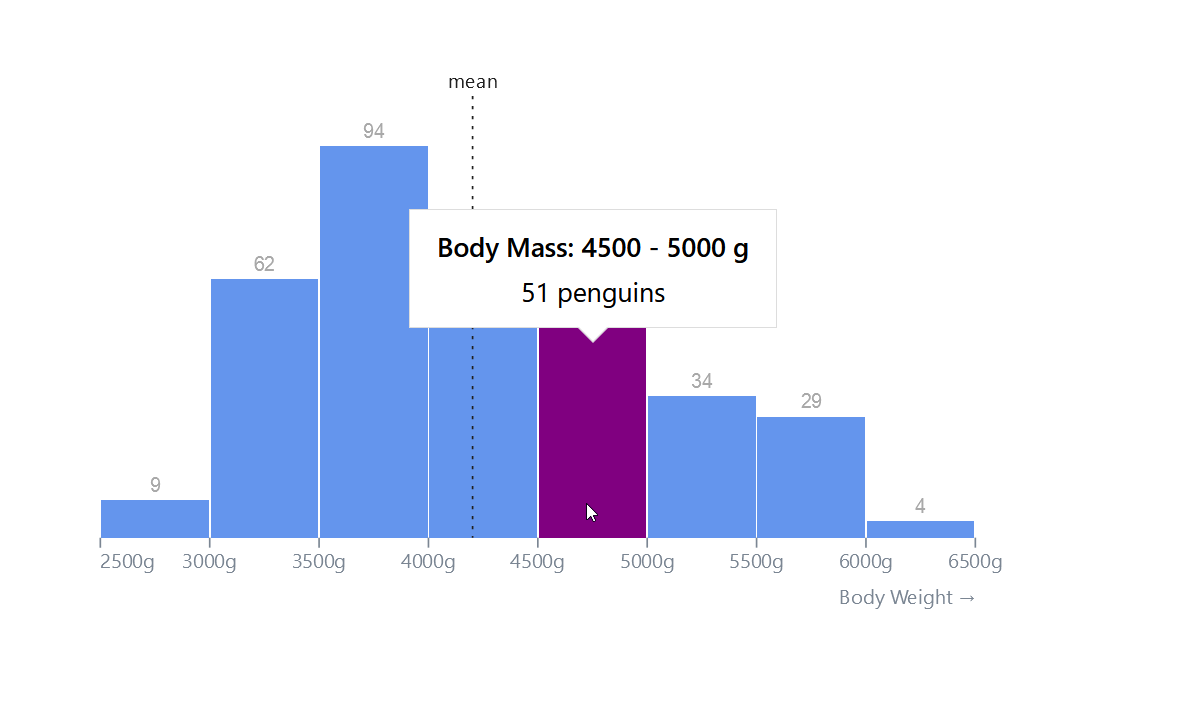
Histogram + Tooltip
Read More